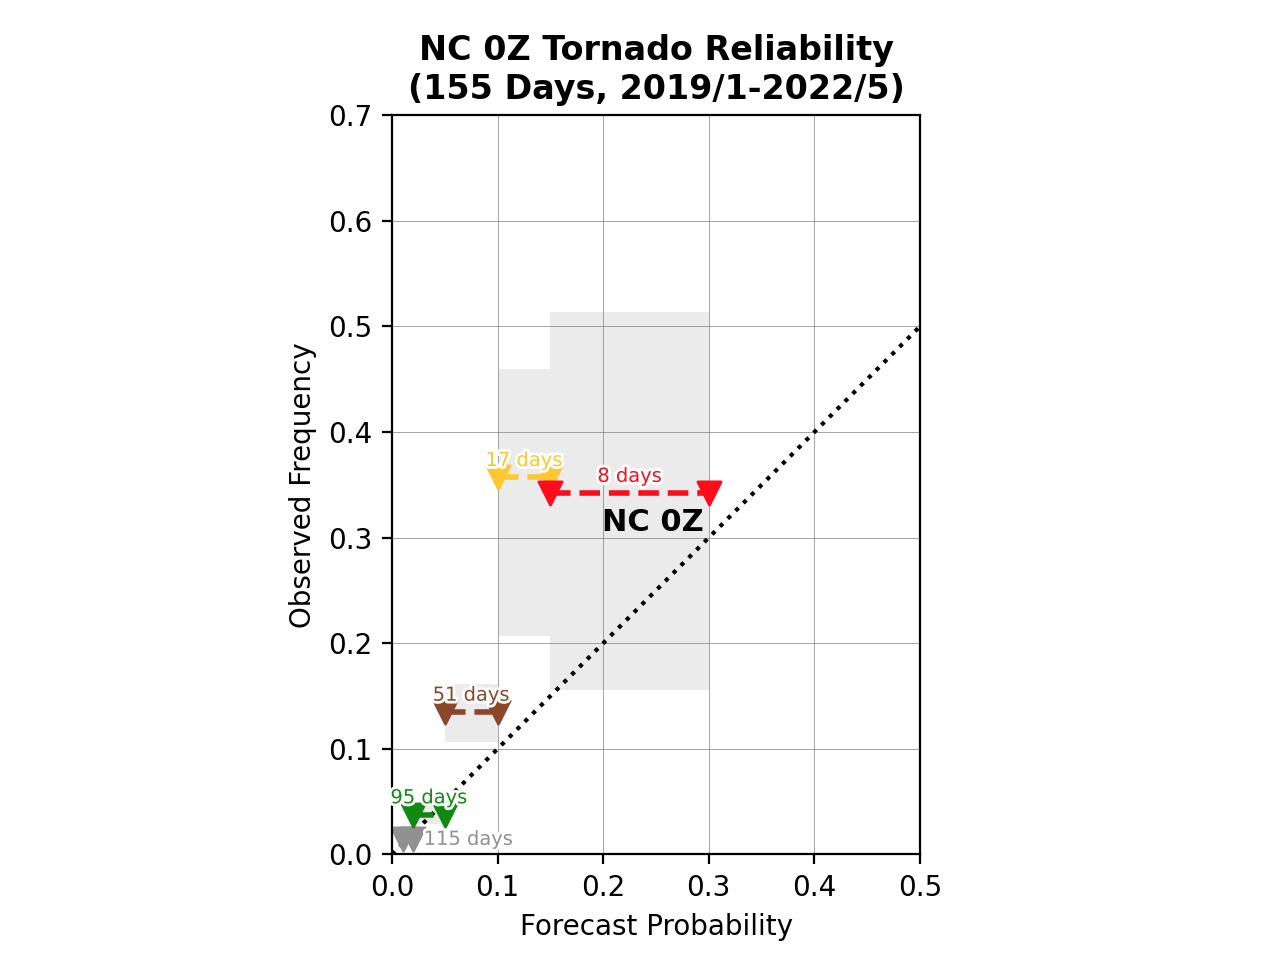
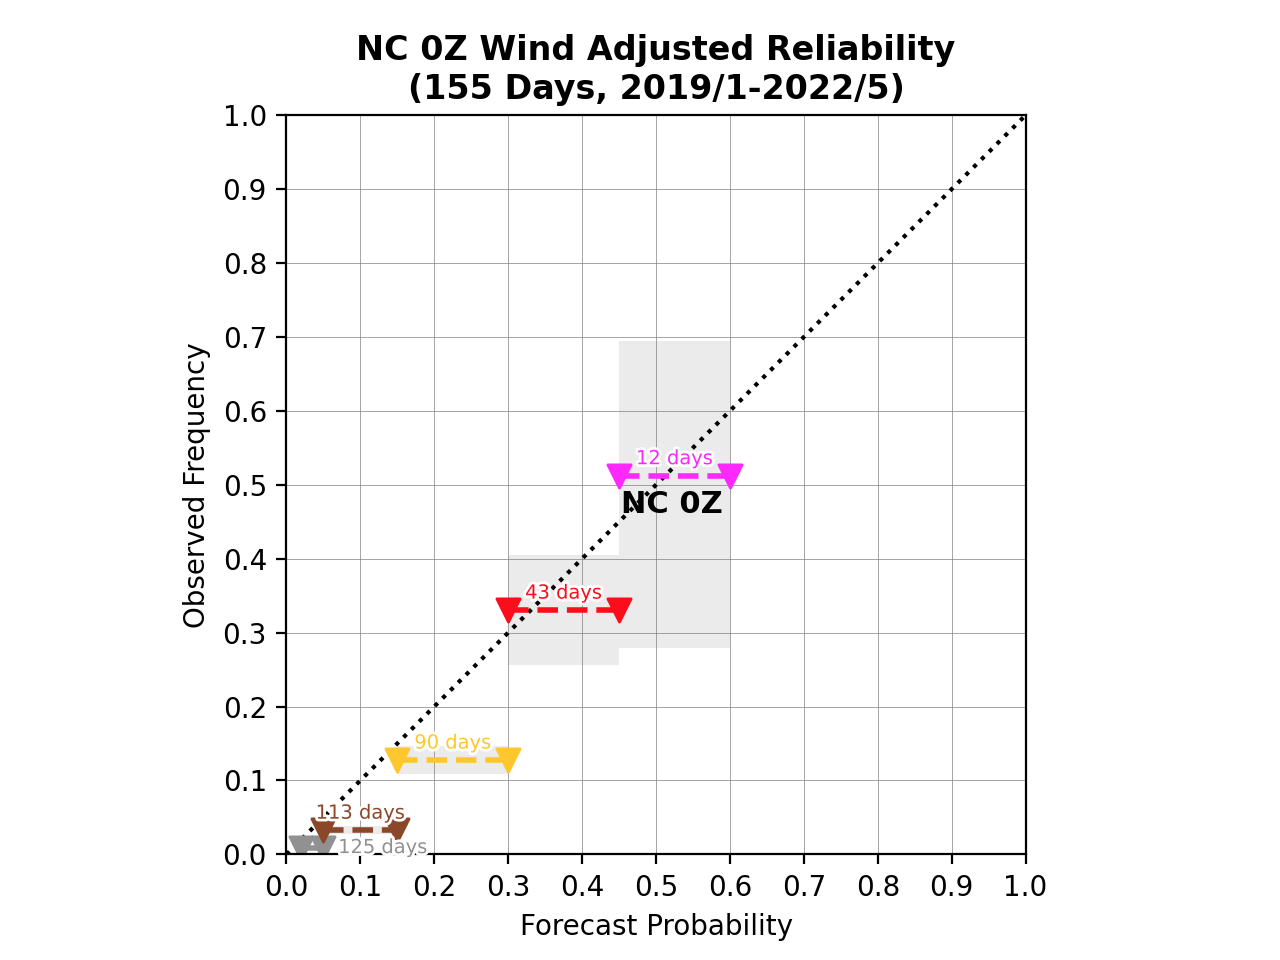
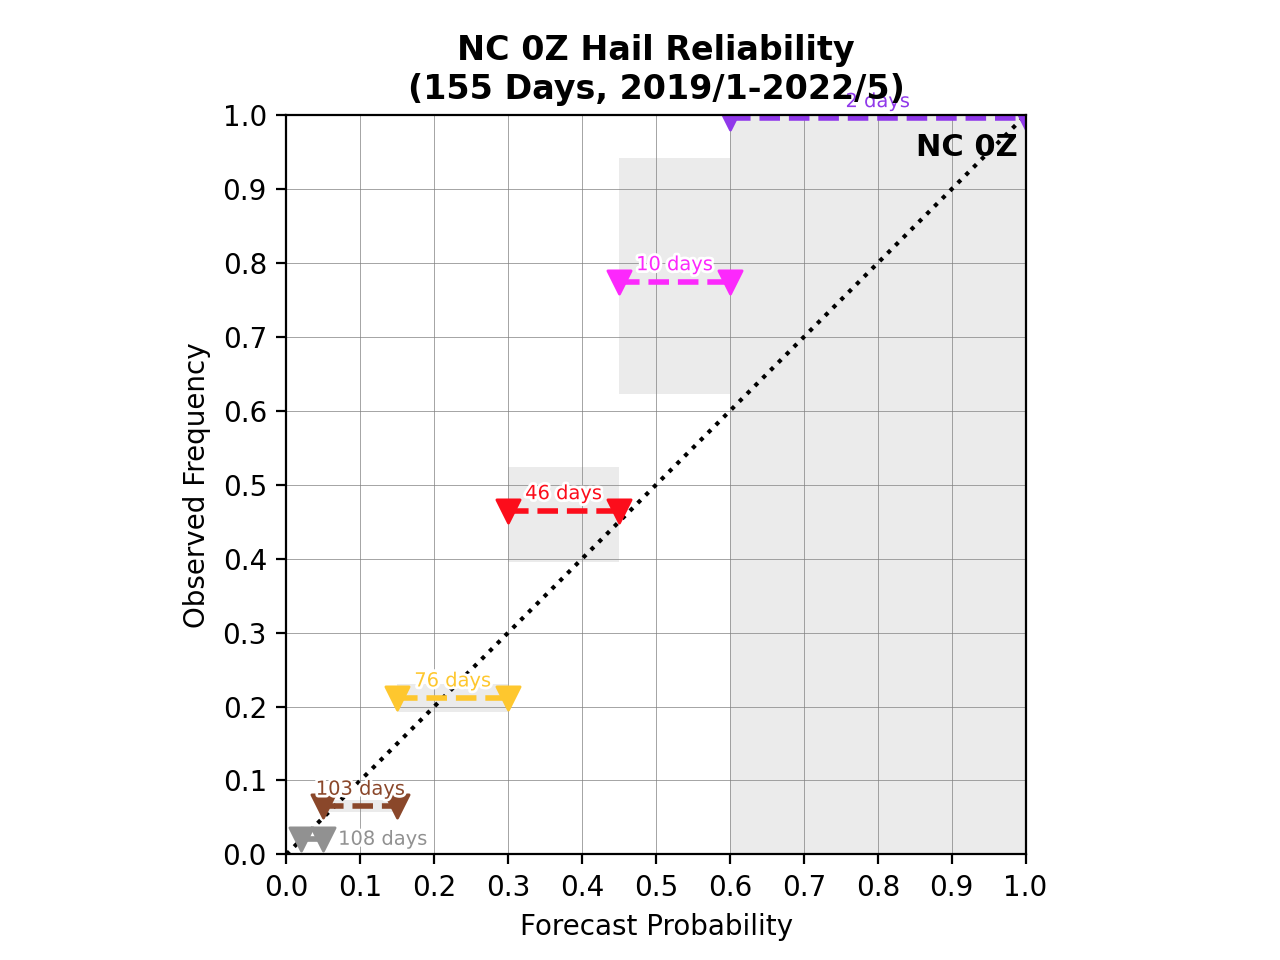
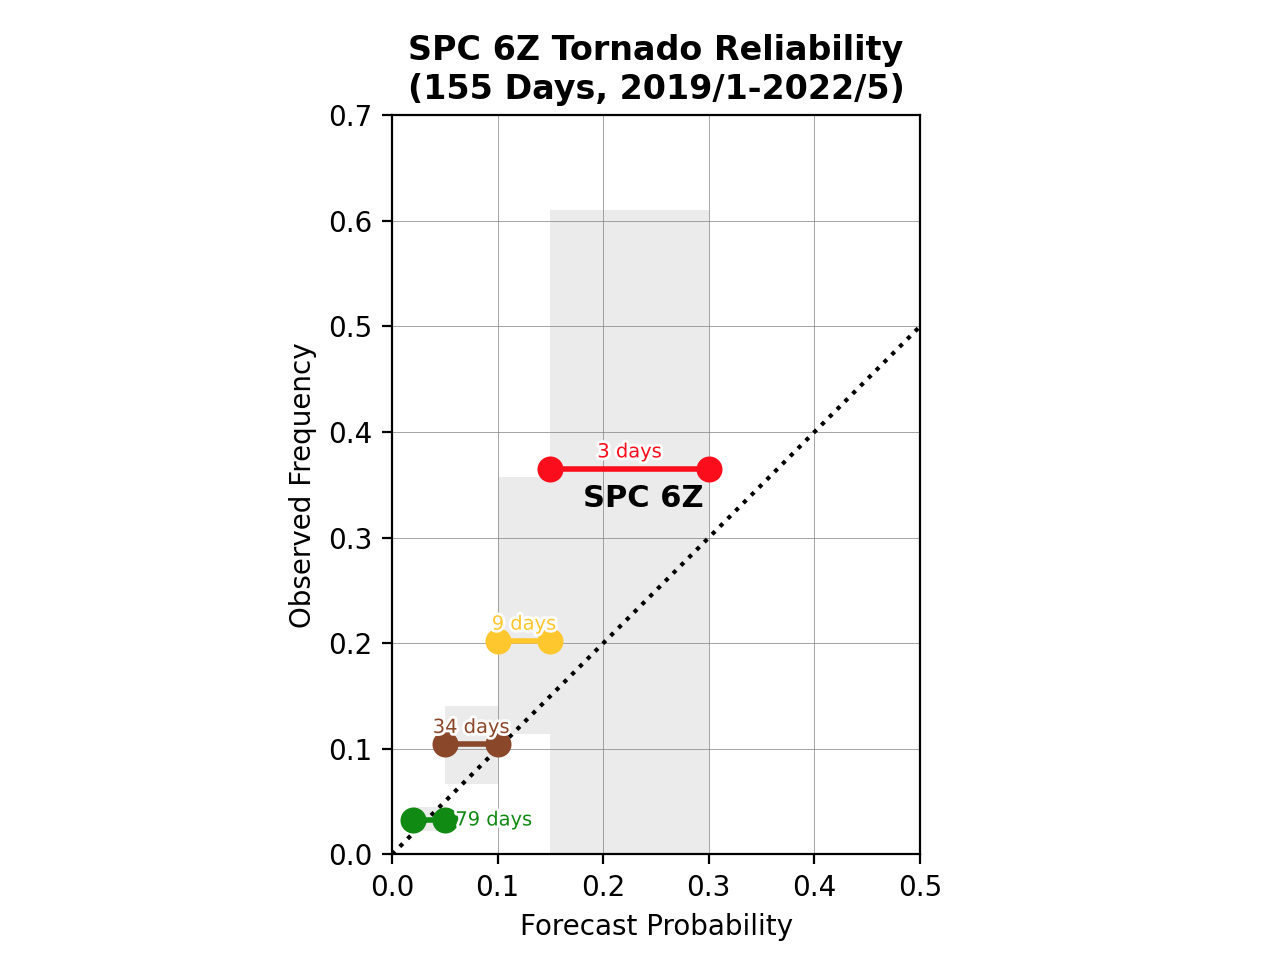
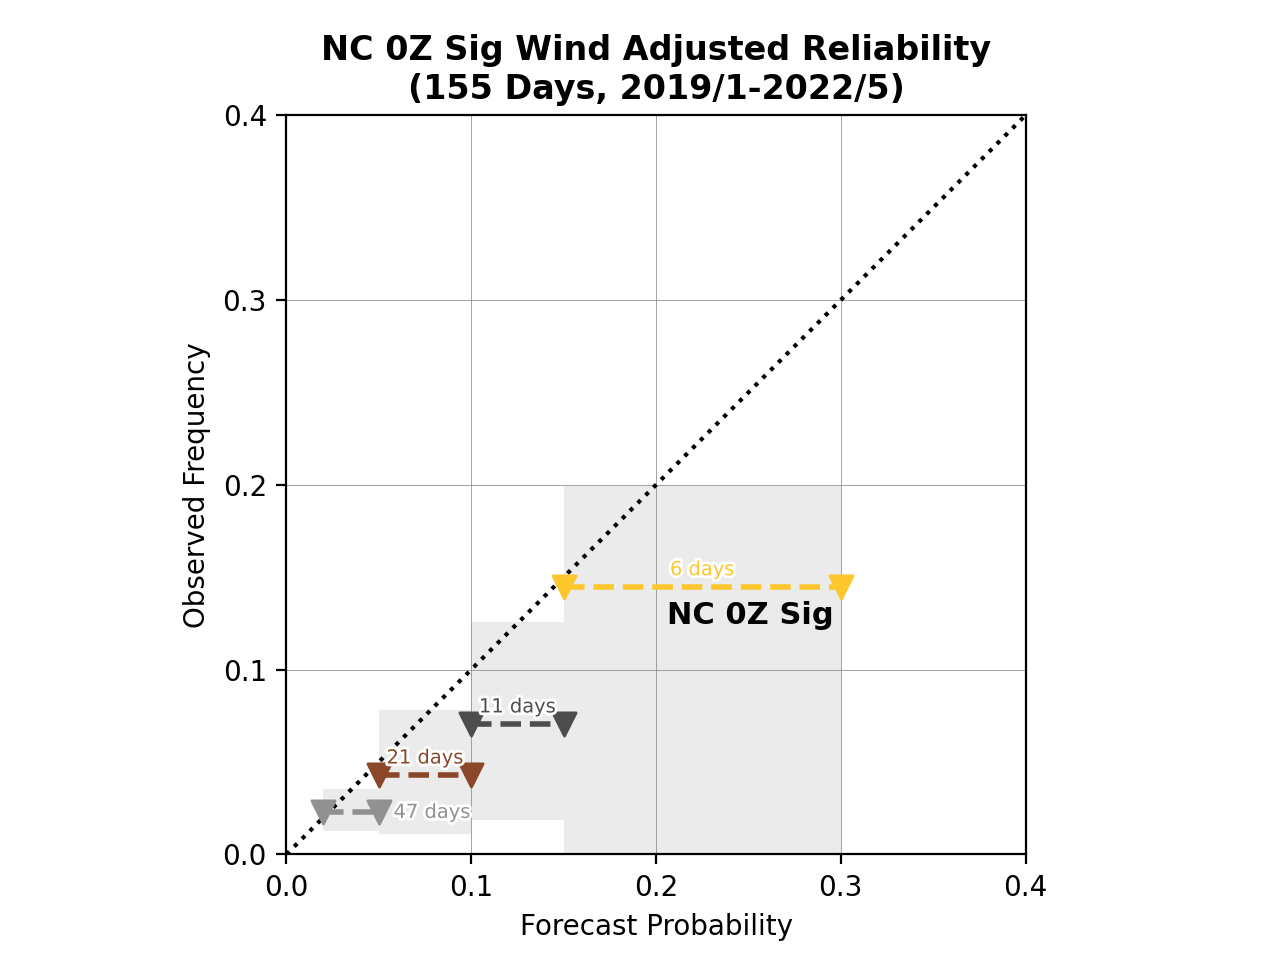
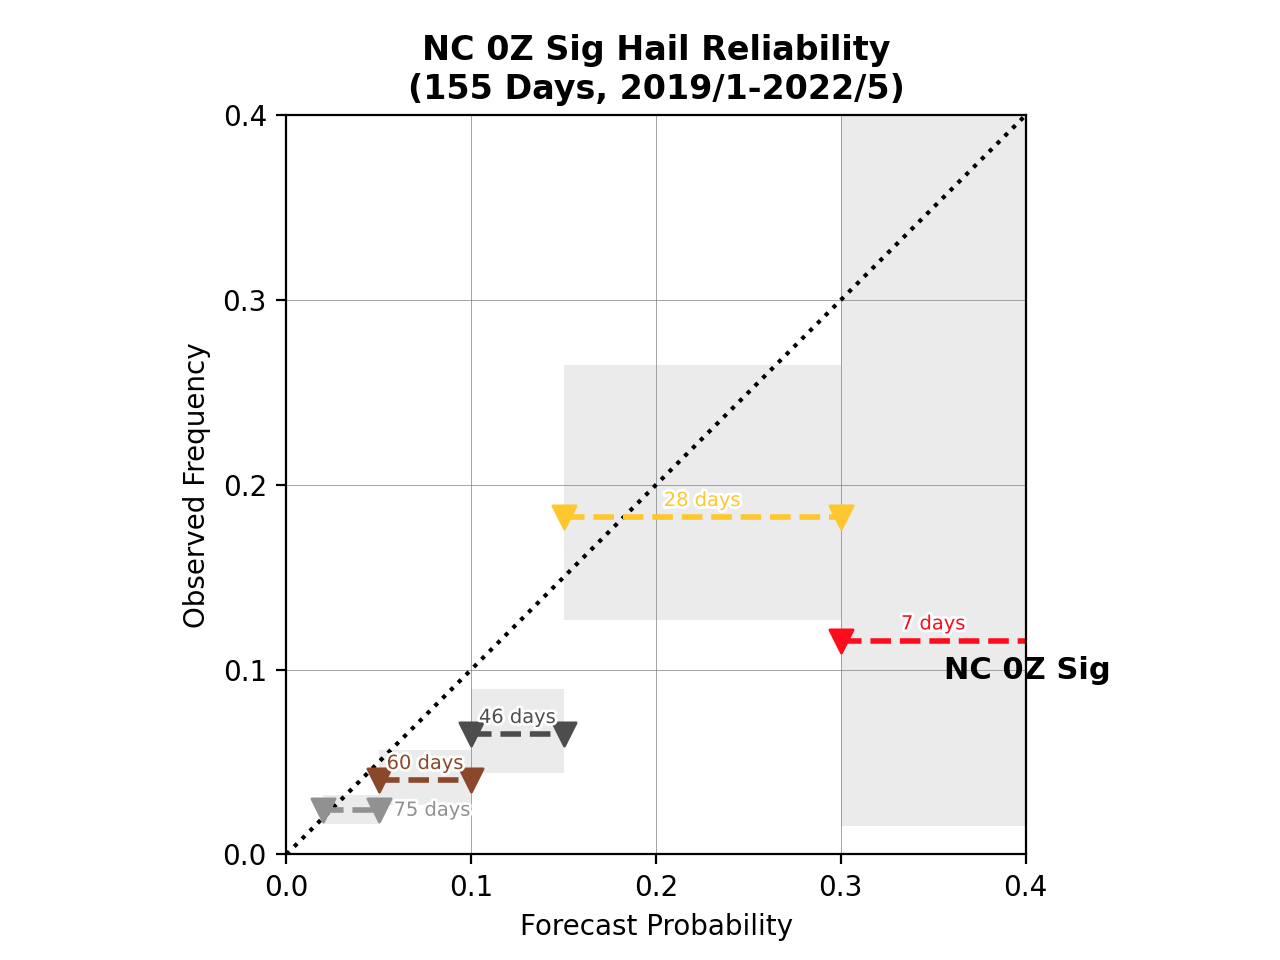
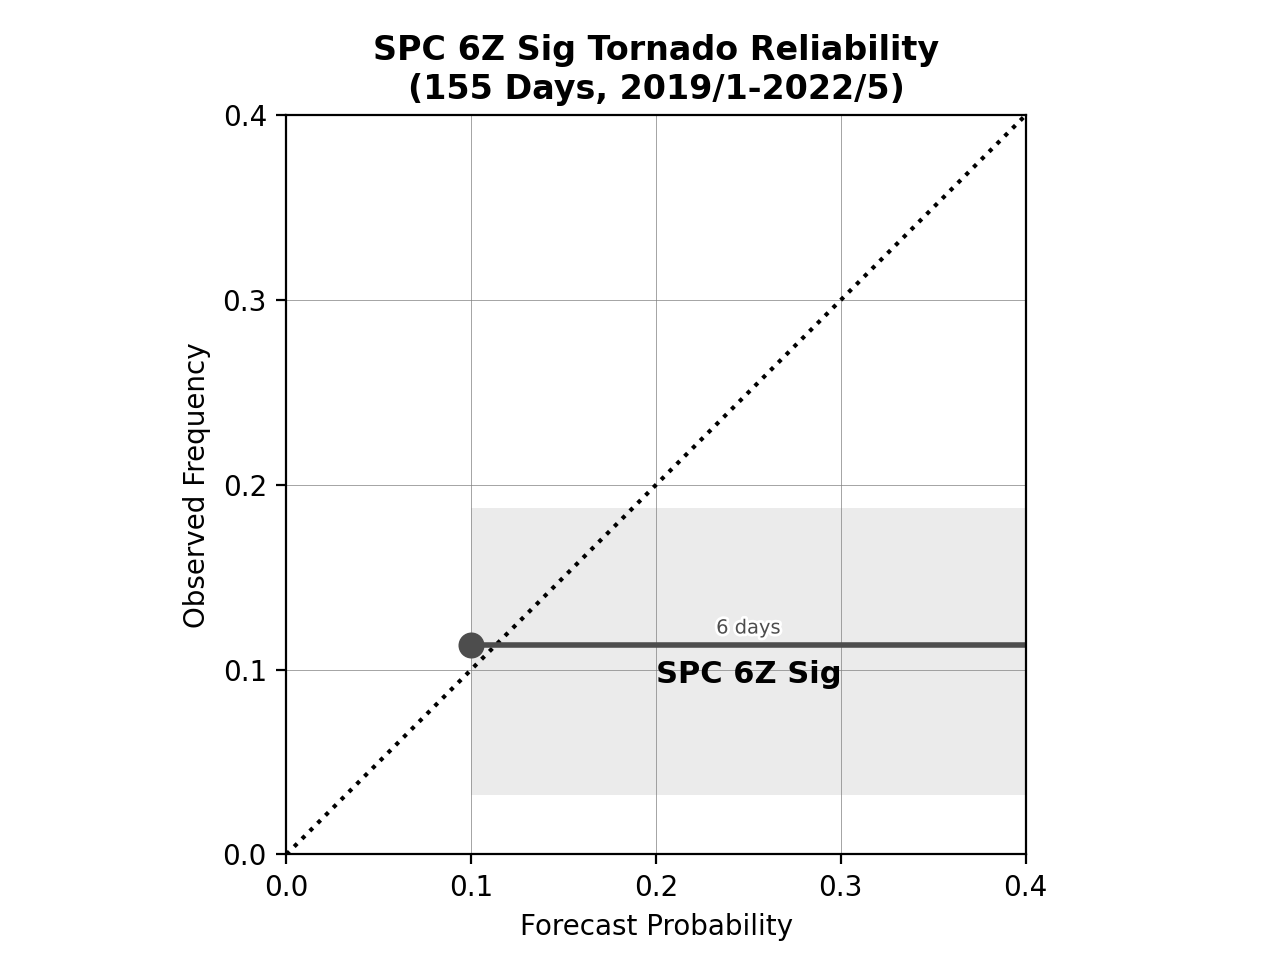
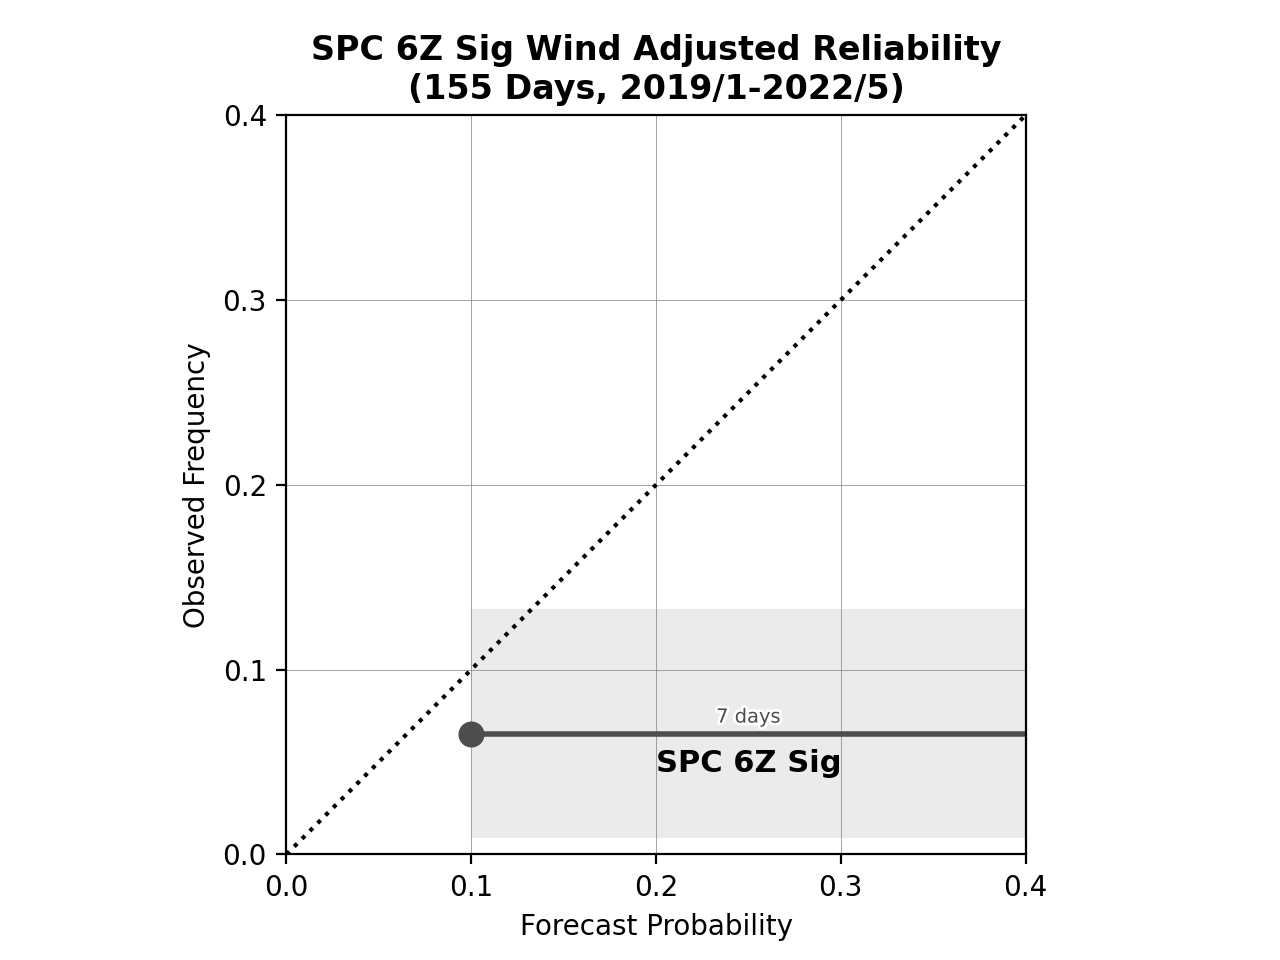
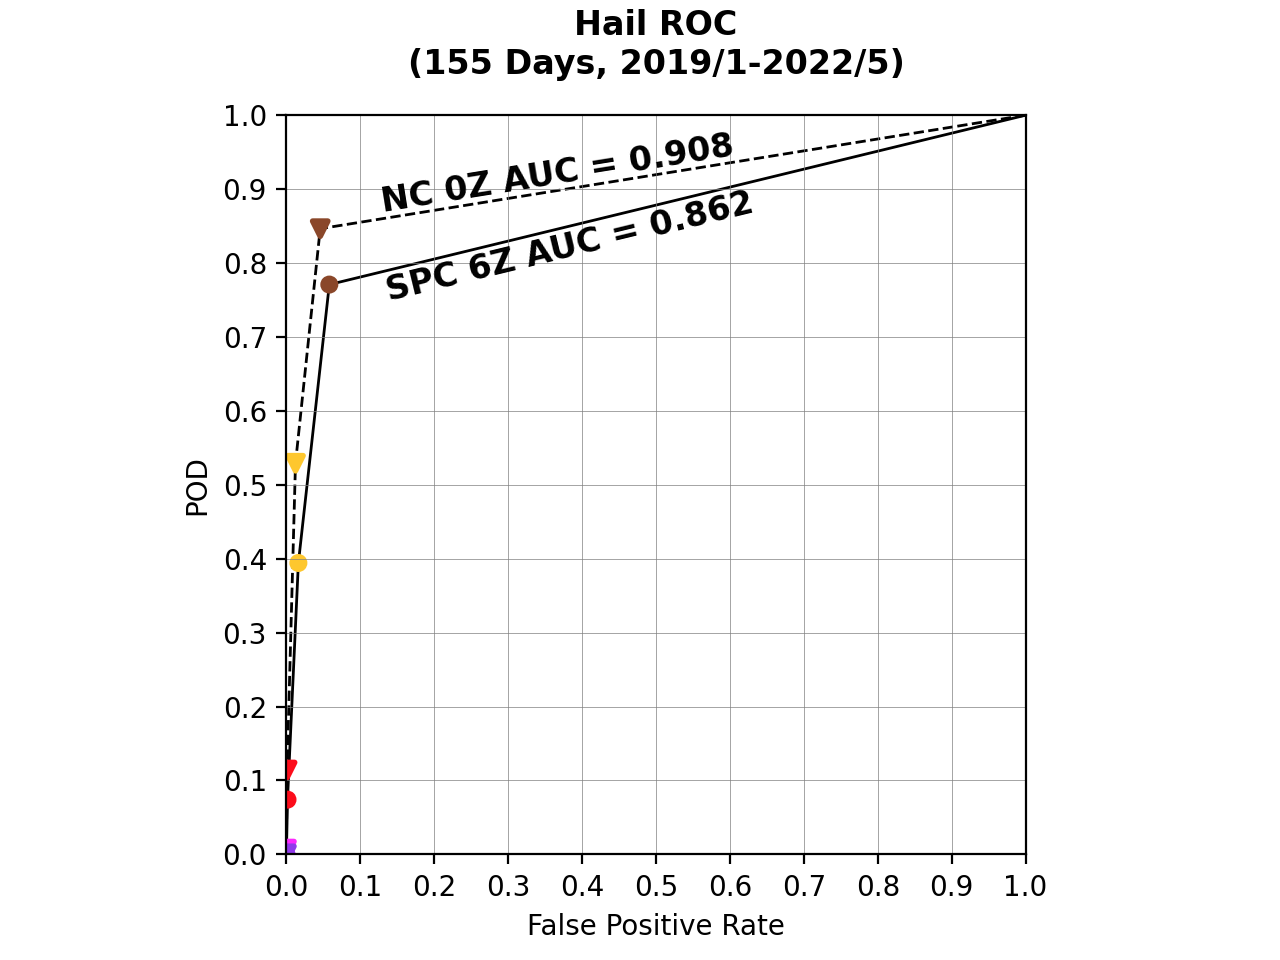
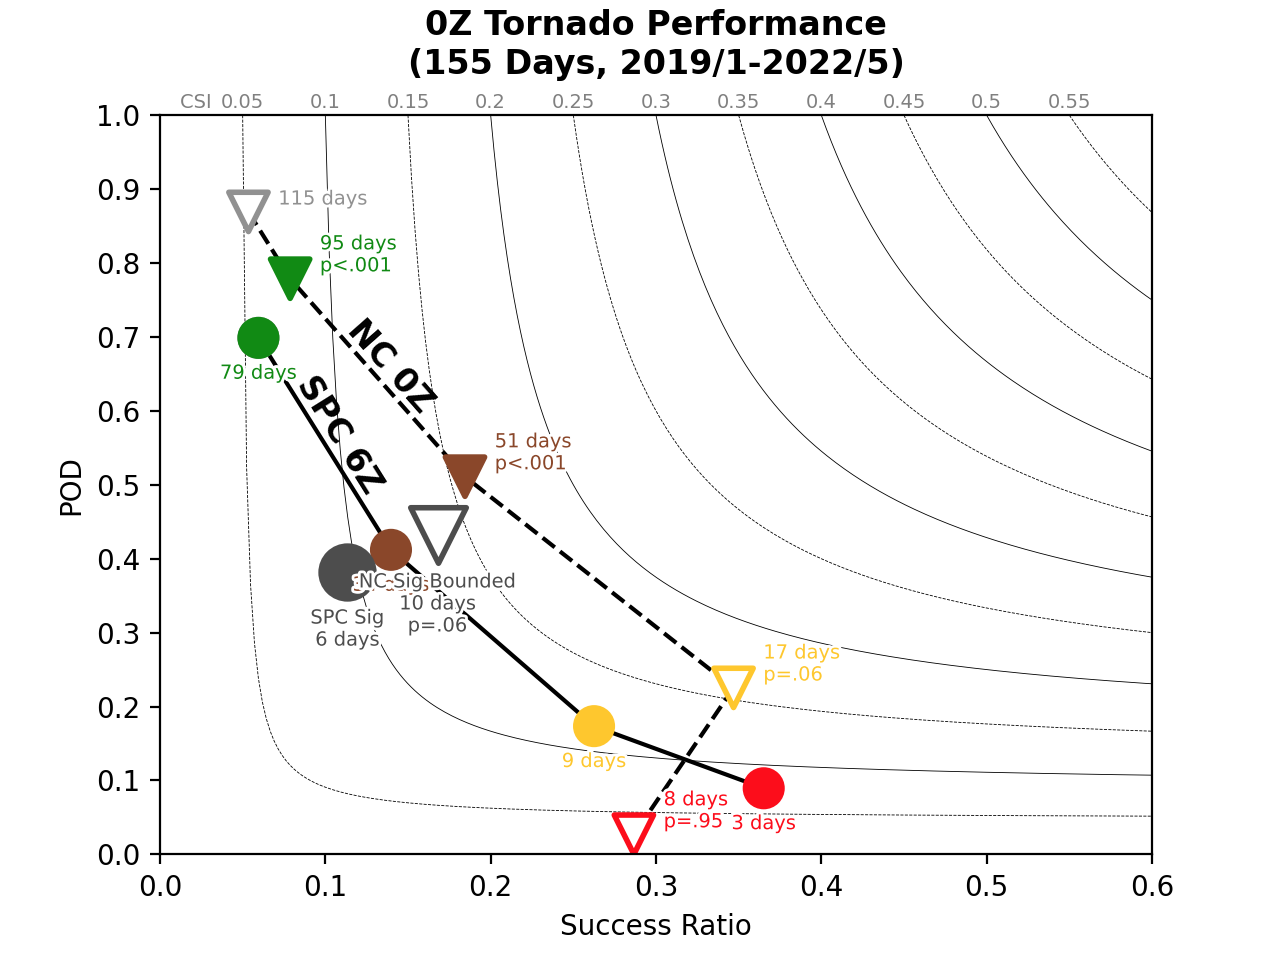
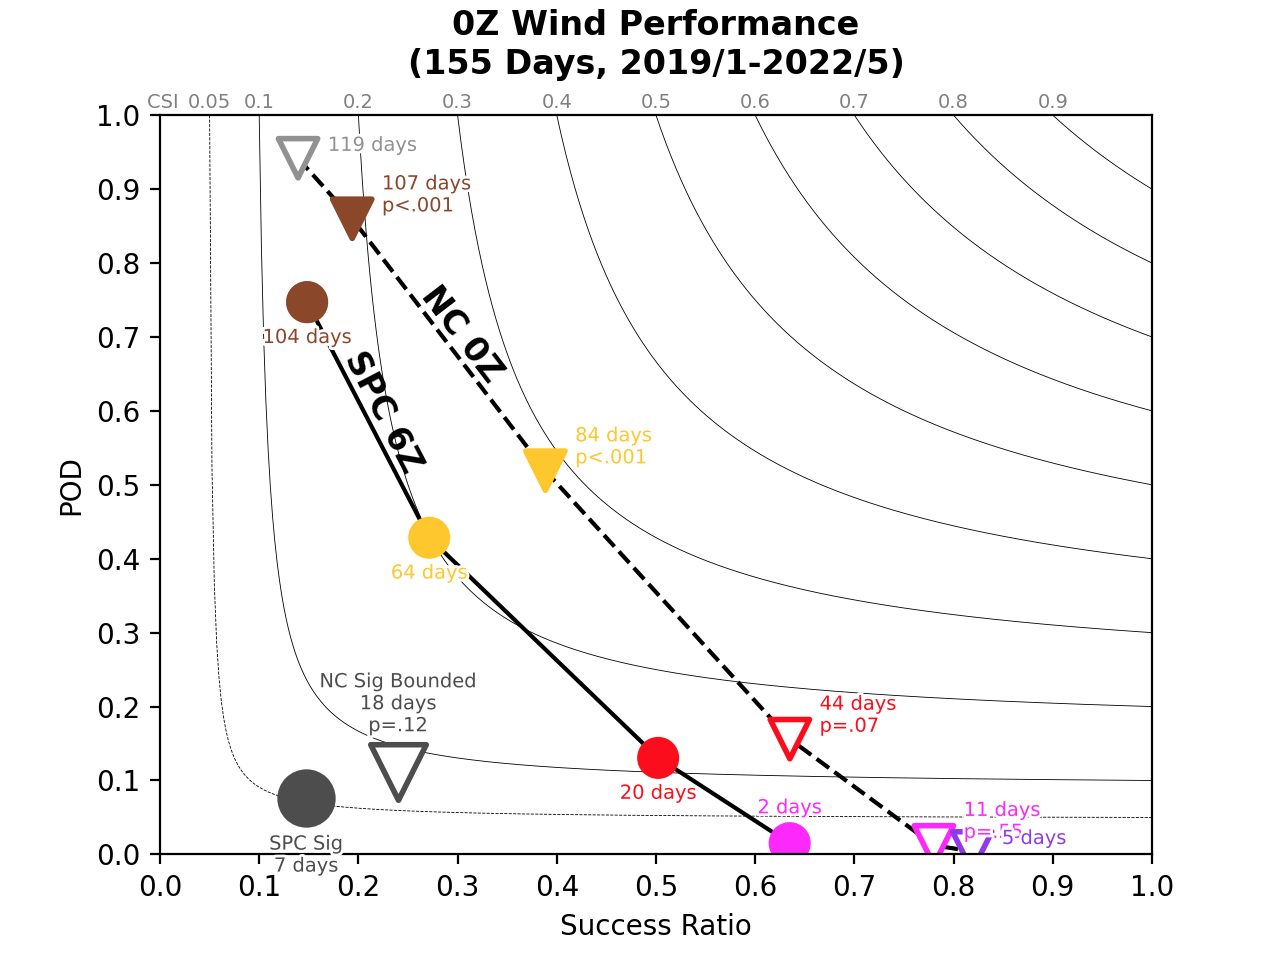
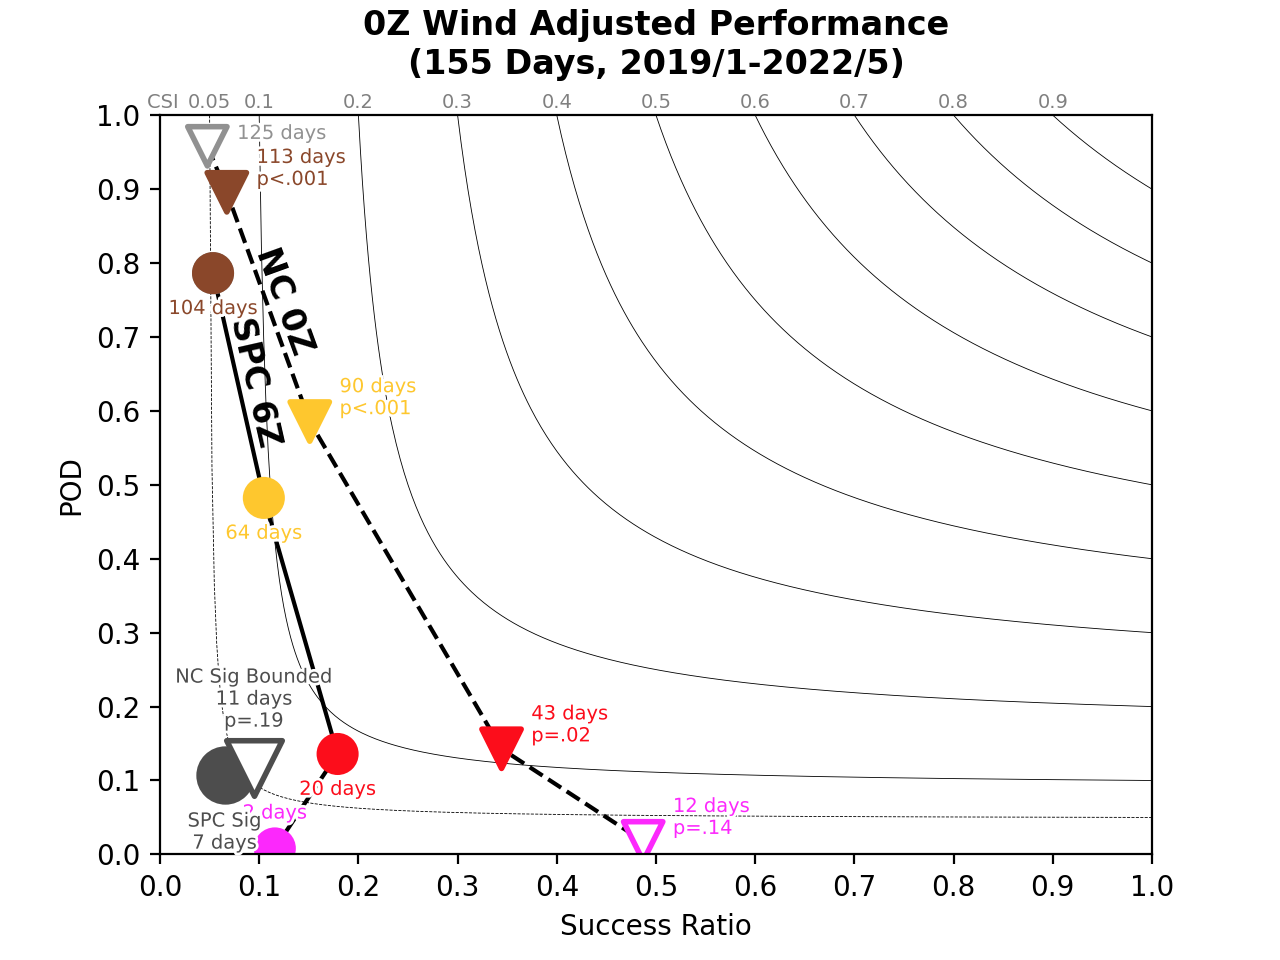
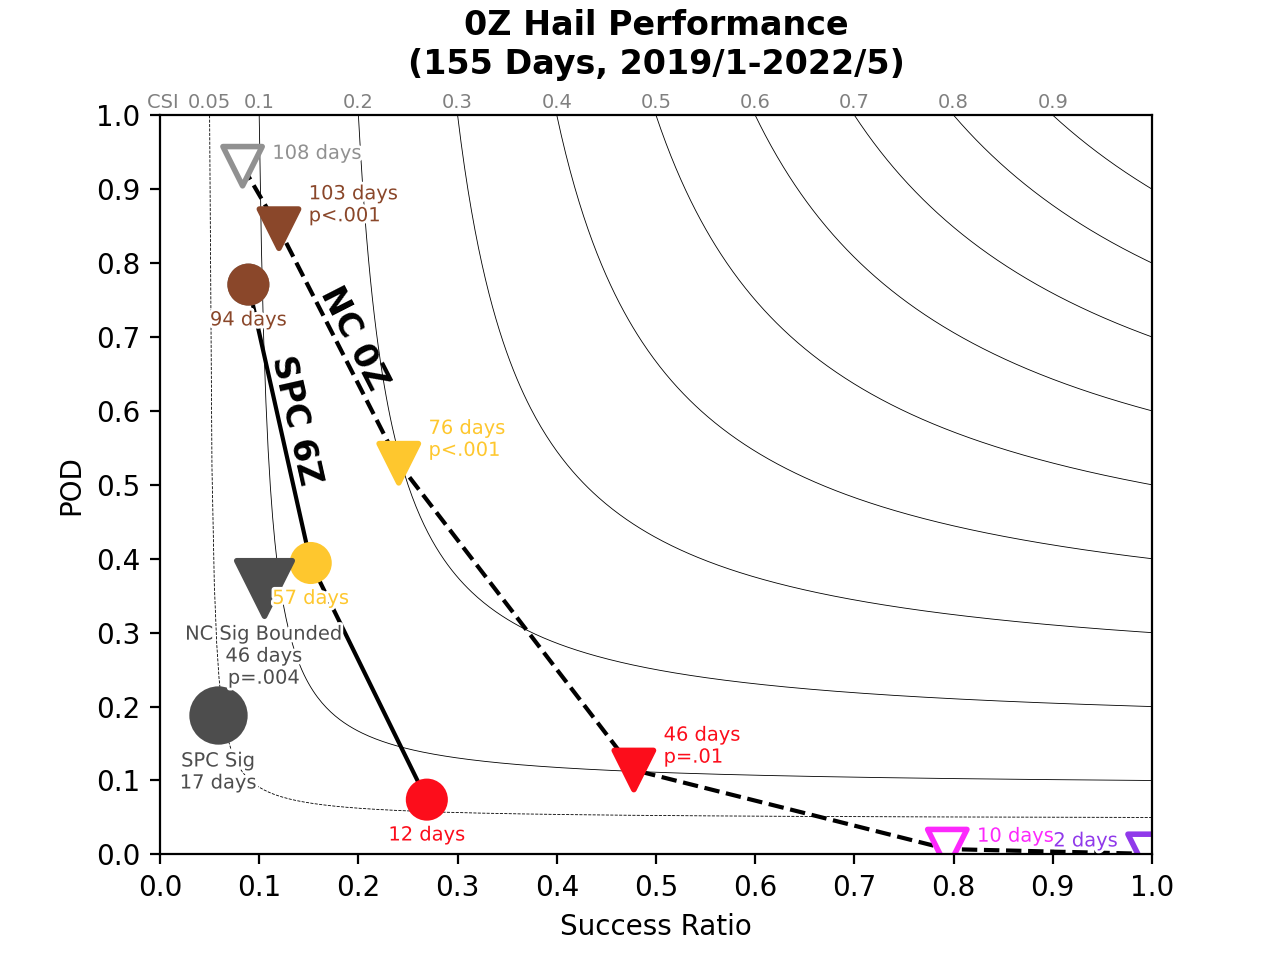
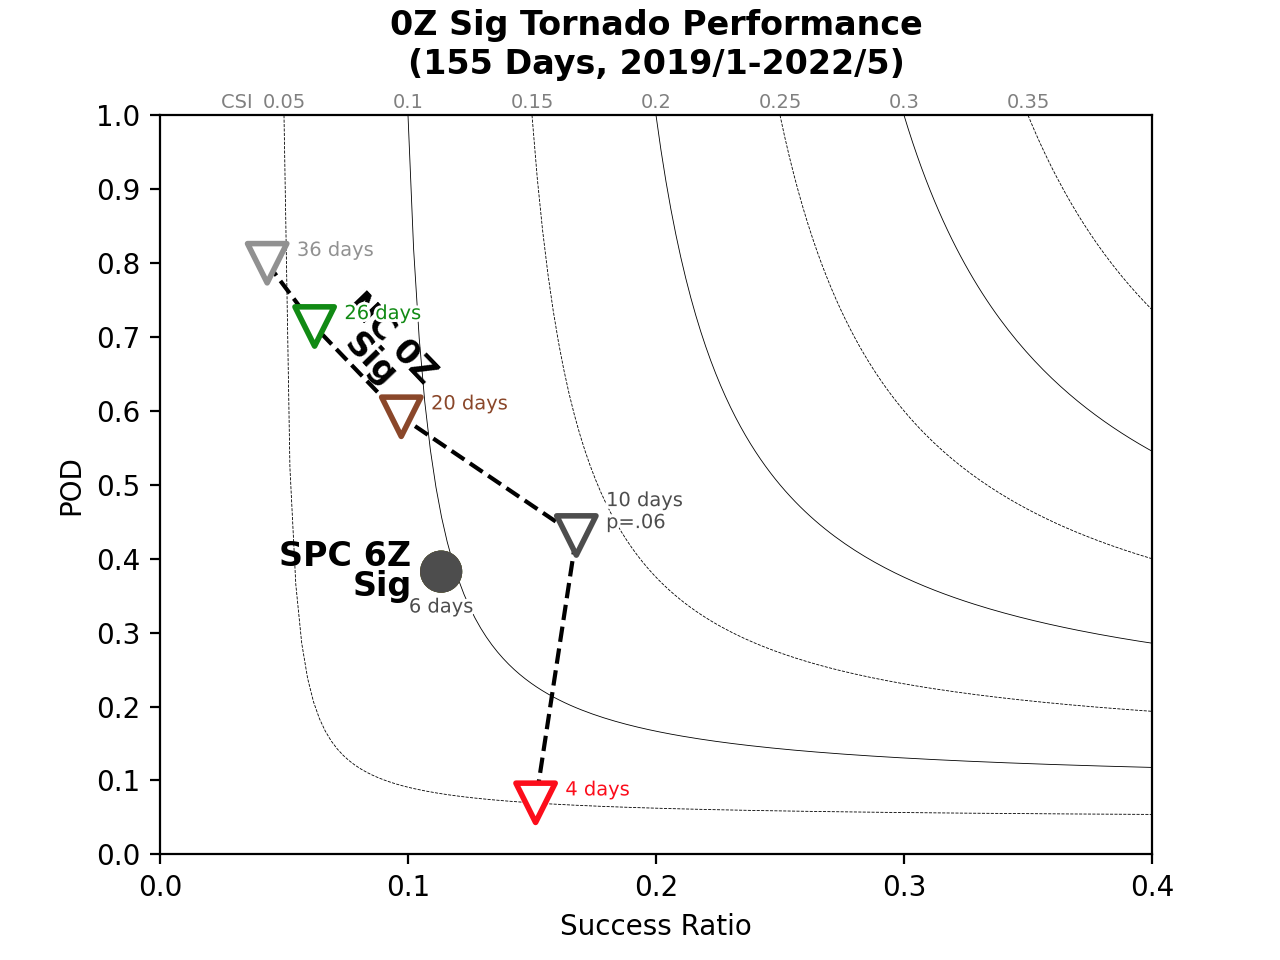
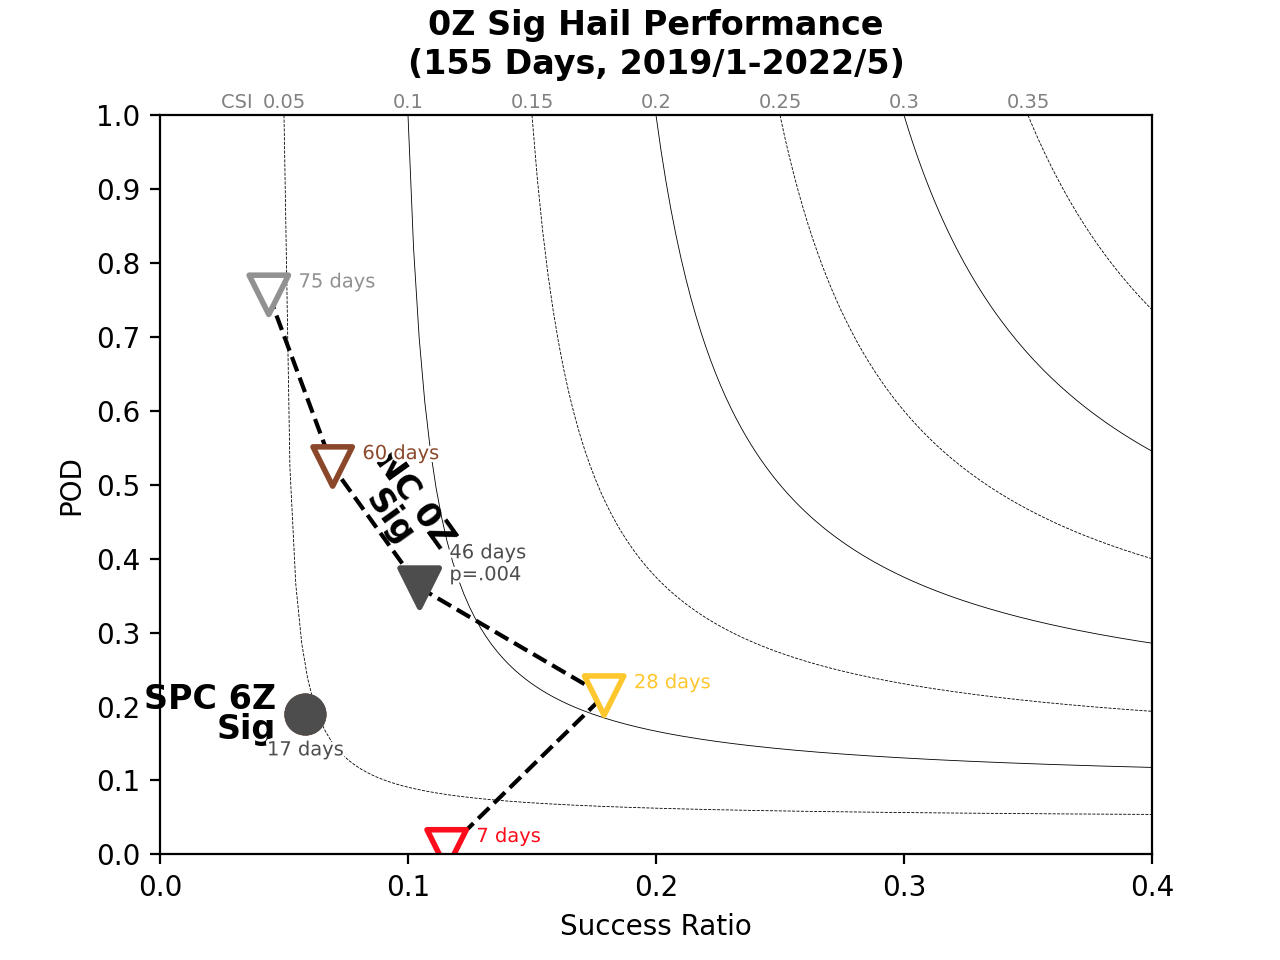
Performance diagrams for Nadocast (NC) day 1 outlooks (triangles) compared to SPC day 1 outlooks (circles), for the 155 days (Sundays) not seen by the models during training and calibration throughout the Jan 2019-May 2021 period. Lines of constant critical success index (CSI) are drawn as light gray curves. The performance for the NC 1% threshold (2% wind and hail) is included as a gray triangle. Significant severe (EF2+, 65kn+, 2in+) 10% thresholds are drawn as large black symbols. The NC sig-severe models are bounded to never output probabilities higher than the NC non-sig probability. To assess statistical significance, for each threshold the difference between the NC and SPC CSI is compared across 1 million bootstrap resamples of the 155 days. The p value for NC CSI exceeding SPC SCI is shown; the NC triangle is drawn with solid fill when p<.05 (i.e. when NC is statistically more skillful).
 |
 |
 |
 |
 |
 |
 |
 |
| Area to the Left of the Performance Diagram (Stairstep geometry, SPC thresholds only) | |||||||||||||||
|---|---|---|---|---|---|---|---|---|---|---|---|---|---|---|---|
| 0600 SPC | 0Z NC | 0Z NC HREF Only | 0Z NC 2021 | 0Z NC 2021 HREF Only | 1630 SPC | 12Z NC | 12Z NC HREF Only | 12Z NC 2021 | 12Z NC 2021 HREF Only | Mean SPC | Mean NC | Mean NC HREF Only | Mean NC 2021 | Mean NC 2021 HREF | |
| Tornado | 0.105 | 0.150 | 0.148 | 0.138 | 0.139 | 0.136 | 0.171 | 0.170 | 0.162 | 0.167 | 0.120 | 0.161 | 0.159 | 0.150 | 0.153 |
| Wind | 0.196 | 0.308 | 0.312 | 0.300 | 0.305 | 0.237 | 0.334 | 0.340 | 0.340 | 0.344 | 0.216 | 0.321 | 0.326 | 0.320 | 0.324 |
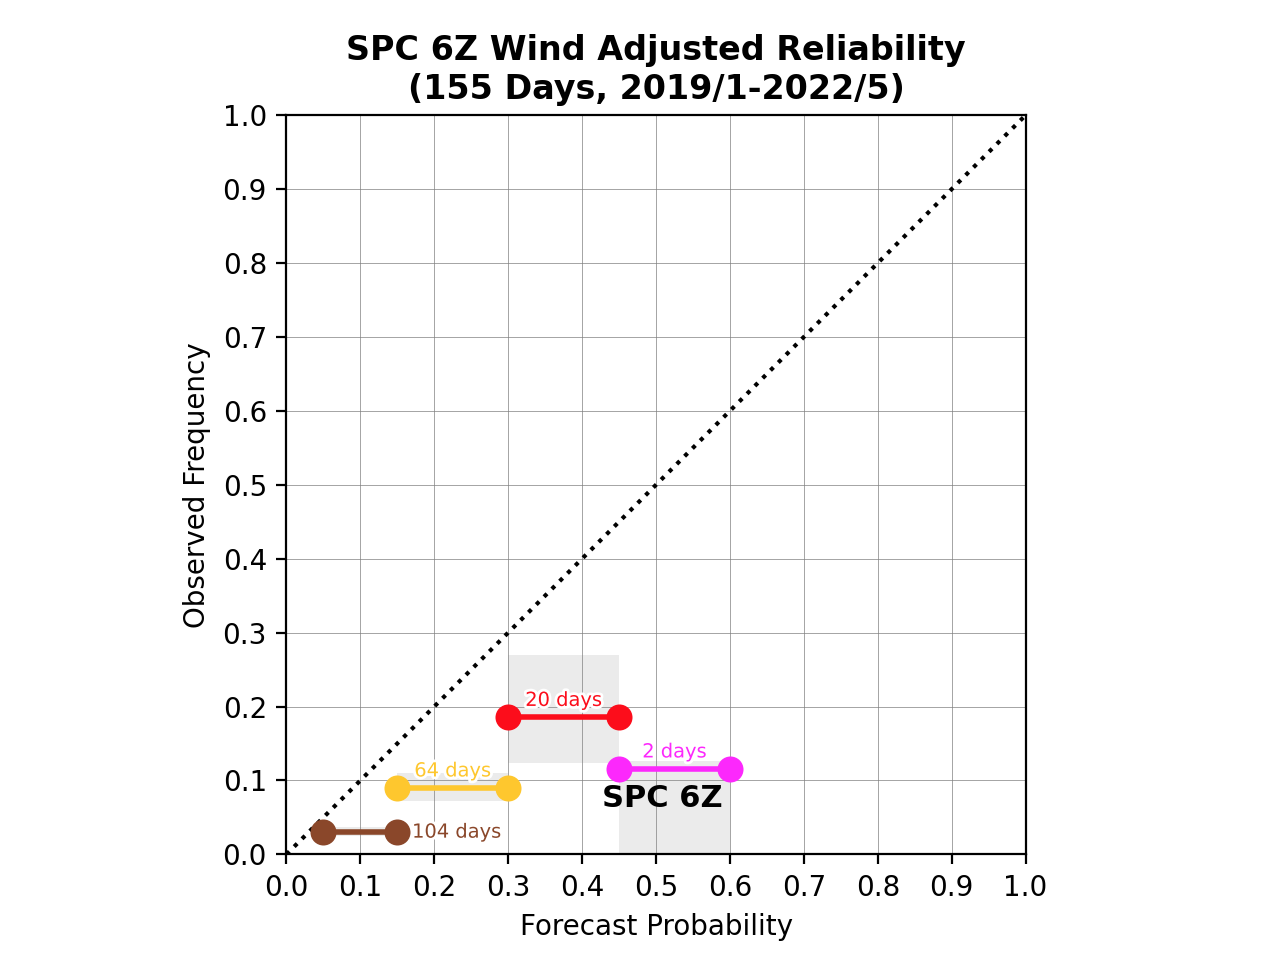
| Wind Adjusted | 0.0763 | 0.139 | 0.144 | 0.0928 | 0.167 | 0.166 | 0.0845 | 0.153 | 0.155 | ||||||
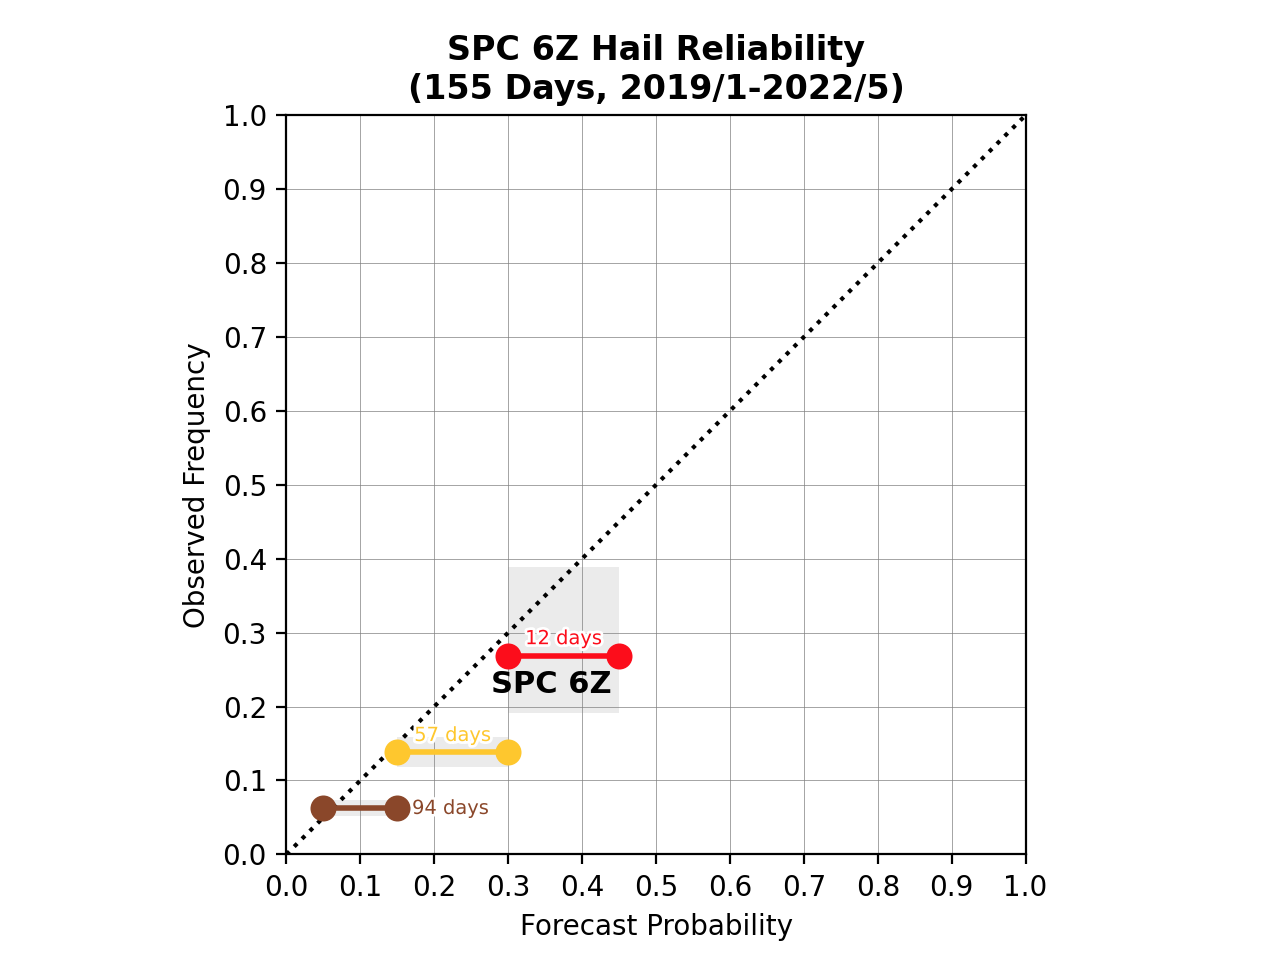
| Hail | 0.102 | 0.195 | 0.196 | 0.193 | 0.193 | 0.129 | 0.224 | 0.224 | 0.221 | 0.223 | 0.116 | 0.210 | 0.210 | 0.207 | 0.208 |
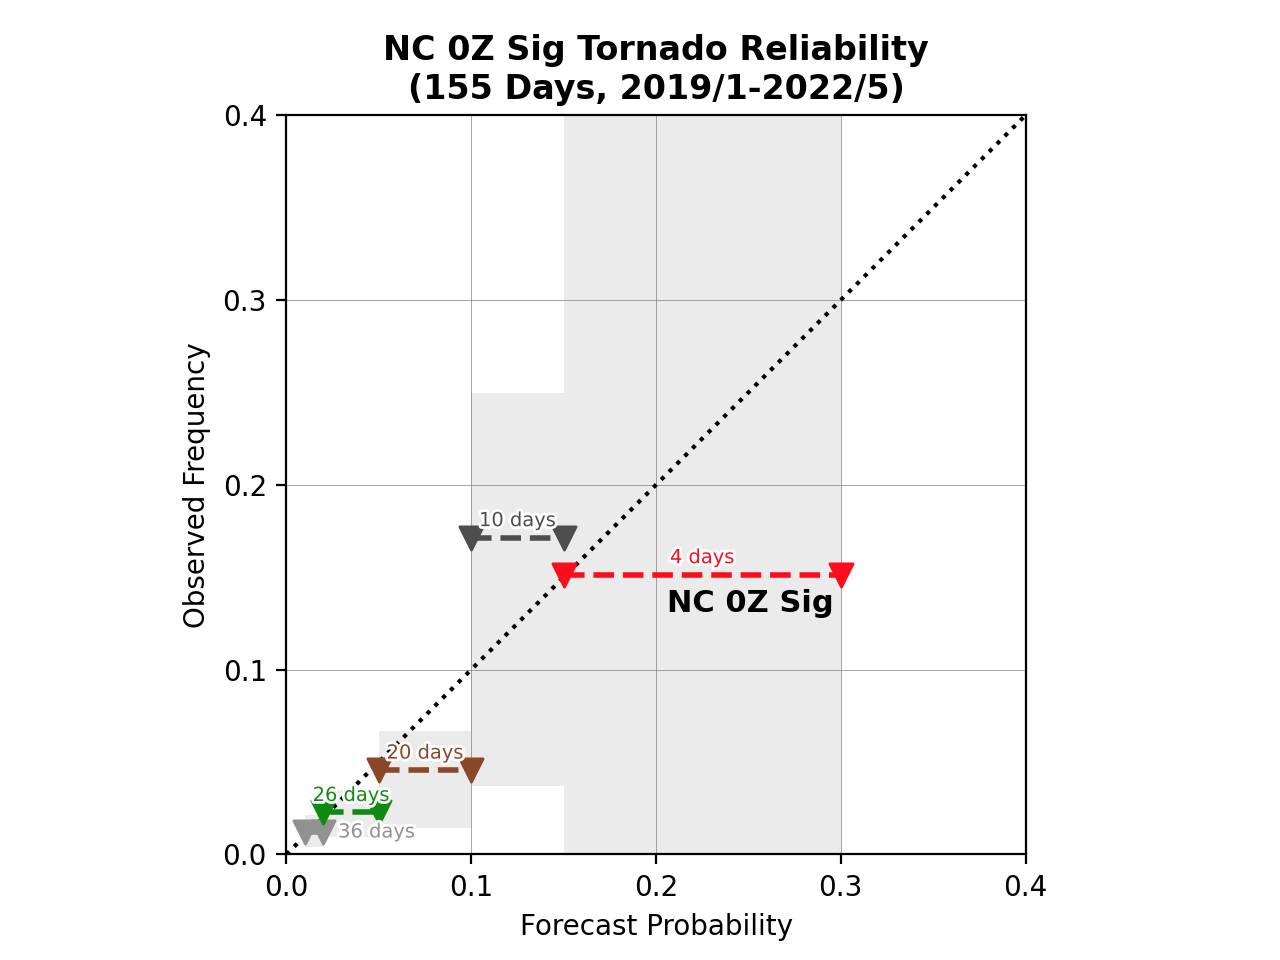
| Sig. Tornado | 0.0434 | 0.0634 | 0.0655 | 0.0588 | 0.0578 | 0.0527 | 0.0809 | 0.0764 | 0.0679 | 0.0726 | 0.048 | 0.0722 | 0.0710 | 0.0633 | 0.0652 |
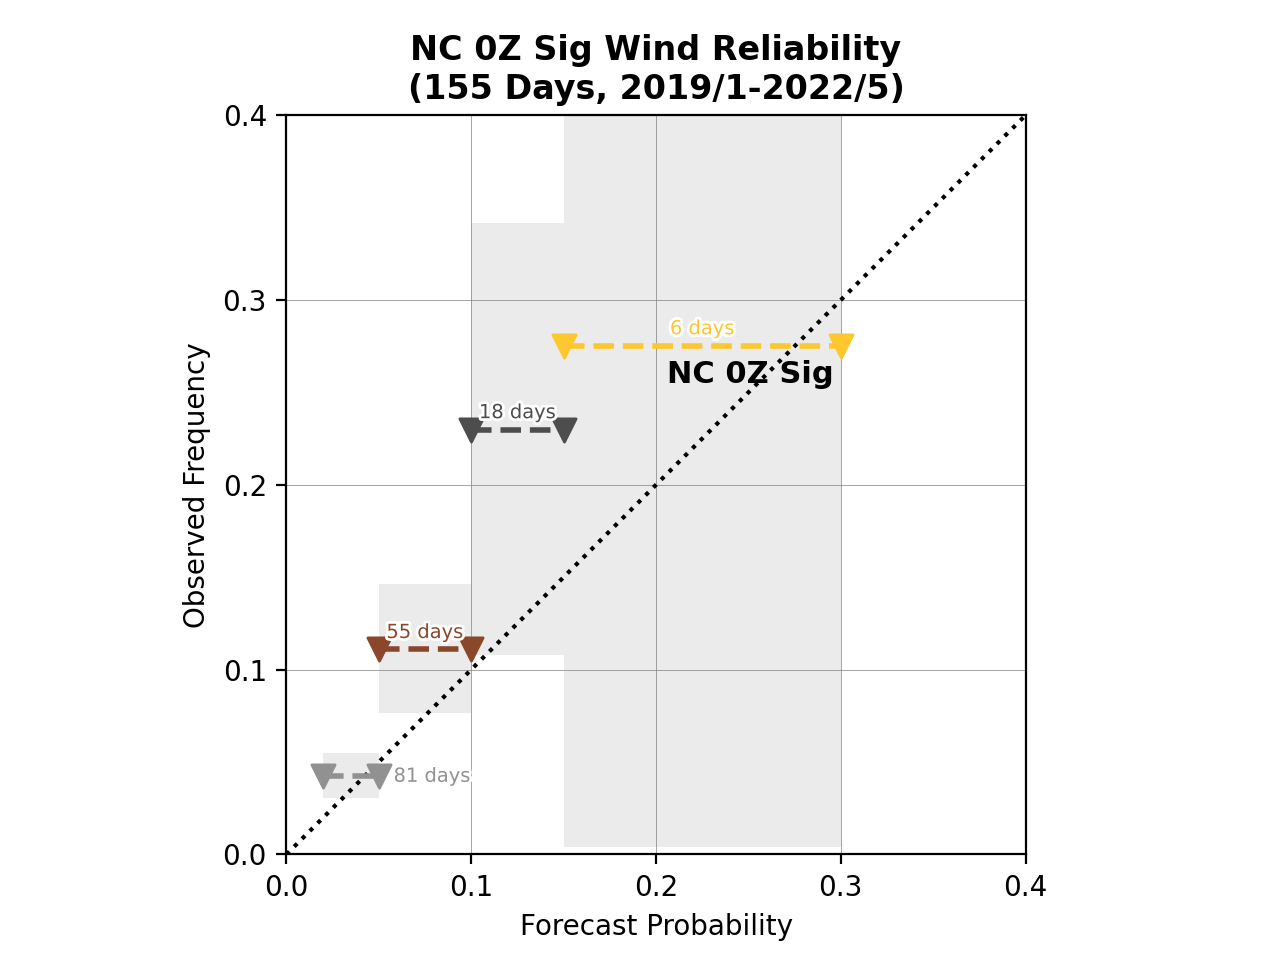
| Sig. Wind | 0.0113 | 0.0267 | 0.0239 | 0.0258 | 0.0255 | 0.0221 | 0.0416 | 0.0435 | 0.0460 | 0.0447 | 0.0167 | 0.0342 | 0.0337 | 0.0359 | 0.0351 |
| Sig. Wind Adjusted | 0.00703 | 0.0111 | 0.0115 | 0.0121 | 0.0105 | 0.0166 | 0.00958 | 0.0108 | 0.0141 | ||||||
| Sig. Hail | 0.0111 | 0.0378 | 0.0428 | 0.0336 | 0.0346 | 0.0272 | 0.0493 | 0.0529 | 0.0406 | 0.0423 | 0.0191 | 0.0435 | 0.0478 | 0.0371 | 0.0385 |